In today’s fast-paced world, technology is advancing faster than we can imagine. That’s why it’s crucial to have tools that make our work easier and more efficient. One such tool is Allure Framework, a comprehensive testing solution used by developers worldwide. But what makes Allure Framework stand out from the crowd? The answer lies in its powerful visualization capabilities that allow users to see their test results in a way that is both visually appealing and easy to understand. In this blog post, we’ll explore the power of visualization in Allure Framework and how you can use it to streamline your testing process like never before!
What is Visualization?
Visualization is the process of creating visual representations of data or information. It’s a technique that enables us to understand complex concepts and ideas quickly and easily. In today’s world, where we are bombarded with information from all sides, visualization plays a crucial role in helping us make sense of it all.
There are different types of visualization techniques available, such as charts, graphs, diagrams, maps, and more. Each type has its unique advantages depending on the kind of data you want to present.
Visualizations help users identify patterns or trends that might not be visible in raw data alone. They can also highlight significant outliers or anomalies that require further analysis.
Visualization is an essential tool for understanding complex data sets at a glance. By presenting information visually through interactive dashboards or reports with Allure Framework’s powerful capabilities in this area – developers can gain insights into how their code performs across various testing scenarios without having to comb through mountains of raw data manually!
The Different Types of Visualization
Visualization is a powerful technique that can help you understand complex data and identify patterns. There are different types of visualization, each with its own strengths and weaknesses.
One type of visualization is the bar chart, which shows the frequency or distribution of a single variable. This type of graph is useful for comparing groups or categories within a single variable.
Another type of visualization is the scatter plot, which shows how two variables are related to each other. This type of graph is helpful for identifying patterns in data and understanding relationships between variables.
Heat maps are another type of visualization that display values using color coding. They’re often used to show changes over time or across geographic regions.
Line charts are also common types of visualizations that show trends over time. They’re especially useful when trying to identify changing patterns or trends in data sets.
Pie charts provide an easy-to-understand way to see how parts relate to the whole, making them ideal for presenting proportions and percentages.
Choosing the right type of visualization depends on what kind of information you want to convey and what insights you hope your audience will gain from it. With so many options available today, experts say that effective visuals require careful consideration both in terms their design as well as their content presentation strategy.
The Benefits of Visualization
Visualization has become a popular technique in various fields, including sports, business, and personal development. This powerful tool involves creating mental images to achieve desired outcomes or goals. Visualization can be used for different purposes such as reducing stress levels, improving focus and concentration, enhancing creativity and productivity.
One of the major benefits of visualization is that it helps individuals to clarify their goals. By imagining themselves achieving their objectives with vivid details, they are more likely to work towards them with greater motivation and purpose. Visualization also increases confidence levels by creating positive mental scenarios that promote self-belief.
Moreover, visualization can also significantly reduce anxiety levels by providing a sense of control over one’s thoughts and emotions. It allows individuals to create a calming environment where they can visualize success without any fear or doubts holding them back.
In addition to these benefits, visualization can also help improve overall performance in specific tasks like public speaking or athletic events by mentally rehearsing the process beforehand. It enhances muscle memory which makes it easier for an individual to perform under pressure since they have already gone through the motions before.
Incorporating visualization into daily routines has proven beneficial for many people in all areas of life from personal growth to professional achievement. It offers individuals an opportunity for introspection while promoting positivity and goal-oriented thinking – key factors in leading successful lives both personally and professionally!
The Allure Framework
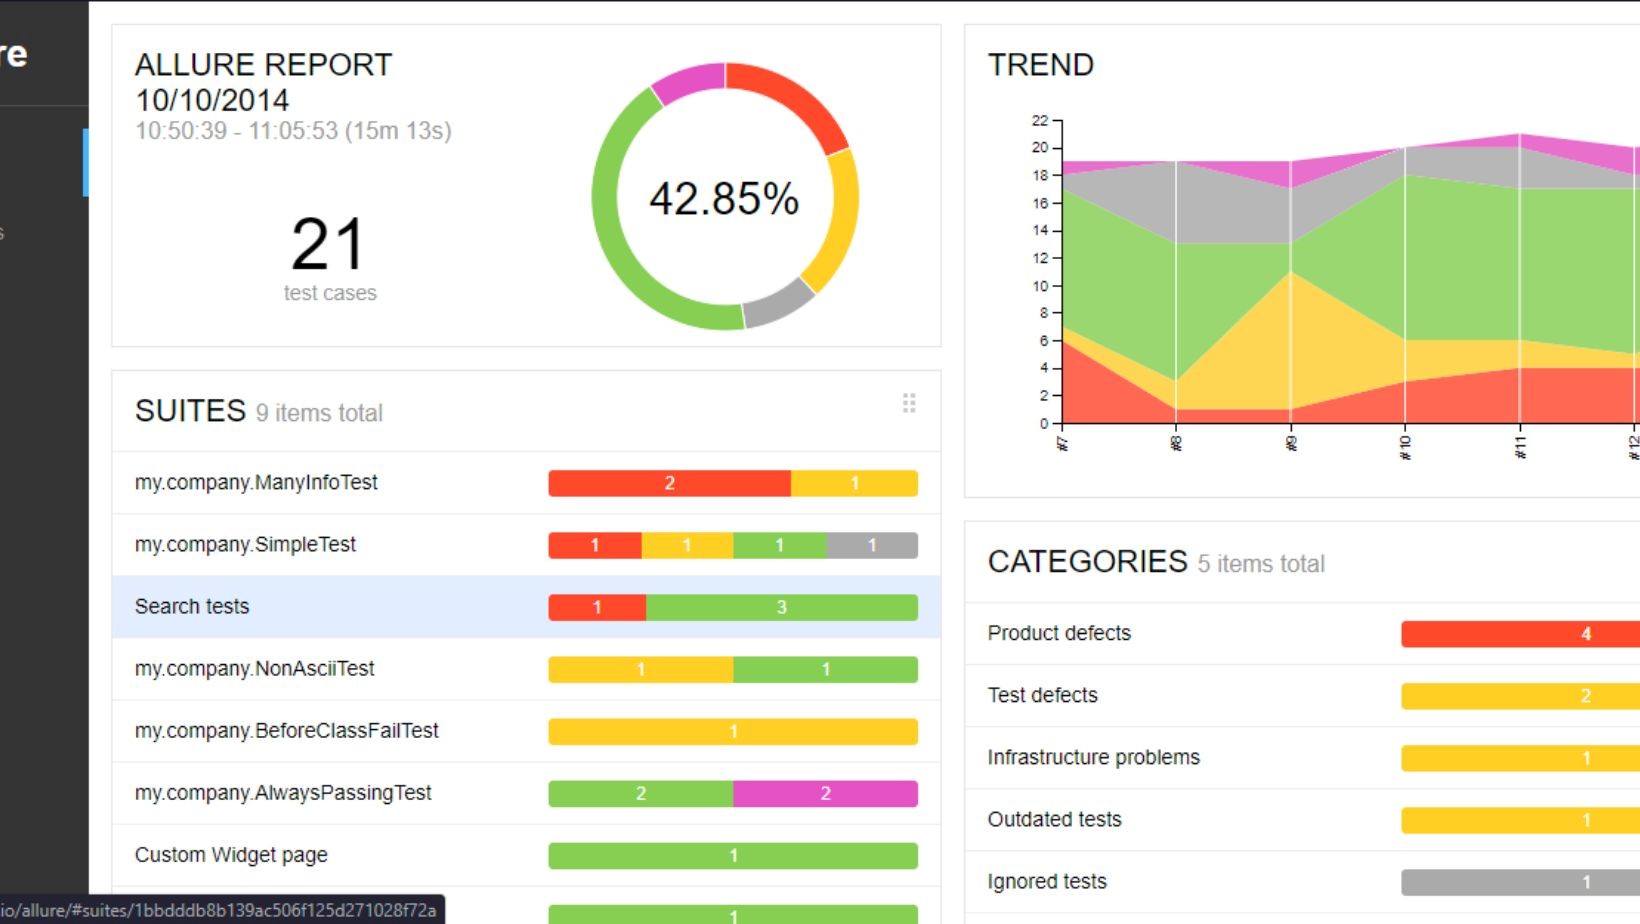
The Allure Framework is a powerful tool that can help developers and testers achieve better visualization of their test results. It offers a comprehensive reporting solution that allows you to generate detailed reports with just a few clicks.
One of the key benefits of using the Allure Framework is its ability to visualize test results in an intuitive way. This makes it easier to identify issues and determine which areas require further testing or improvement.
Another advantage of using this framework is its seamless integration with other popular automation tools such as Selenium, Appium, and Cucumber. This means you can easily incorporate it into your existing workflows without having to make any major changes.
In addition, the Allure Framework provides support for various programming languages including Java, Python, Ruby, and more. So regardless of what language you are most comfortable working with, you can still benefit from this versatile tool.
The Allure Framework is a valuable asset for anyone looking to improve their testing process and gain better insights into their application’s performance. With its user-friendly interface and robust features, it’s no wonder why so many teams choose to incorporate it into their development workflow.
How to Use Visualization in Allure Framework
Using visualization in the Allure Framework is a great way to get an overview of your test results. It helps you quickly understand what tests have passed or failed, and where issues might be occurring.
To start using visualization in Allure, you will need to integrate it into your testing framework. This can typically be done through plugins or extensions that are available for popular testing libraries like Selenium and Appium.
Once integrated, you can begin generating reports that include detailed information about each test case, including steps taken and any errors encountered. These reports can then be viewed in a variety of formats such as HTML or PDF.
One of the key benefits of using visualization in Allure is the ability to create visual representations of your test results. This makes it easy to identify patterns and trends across multiple test cases, allowing you to make informed decisions about how best to optimize your testing processes.
By incorporating visualization into your testing practices with the Allure Framework, you’ll be able to uncover valuable insights that will help improve overall product quality while reducing development time and costs.
Conclusion
To sum up, visualization is an essential tool for software testing that can help us achieve faster and more efficient results. With the Allure Framework, developers have a powerful platform to harness the power of visualization in their daily work. From identifying bugs to tracking progress, visual reports offer a detailed overview of project status and test result trends that allow you to make data-driven decisions.
Using this comprehensive guide as your starting point, you can now get started with using visualization in your development workflow effectively. Remember always to be mindful of your goals while working with any framework or toolset. Keep learning new techniques and approaches so that you can continue improving your skills as a developer.
We hope this article has provided valuable insights into how you can leverage visualization within the Allure Framework to improve software quality assurance processes today!