

Being a business owner has a lot to do with making the right decisions. Several tools are available to make your decision-making process more straightforward, and that’s why you need to understand how to use the available visualization tools.
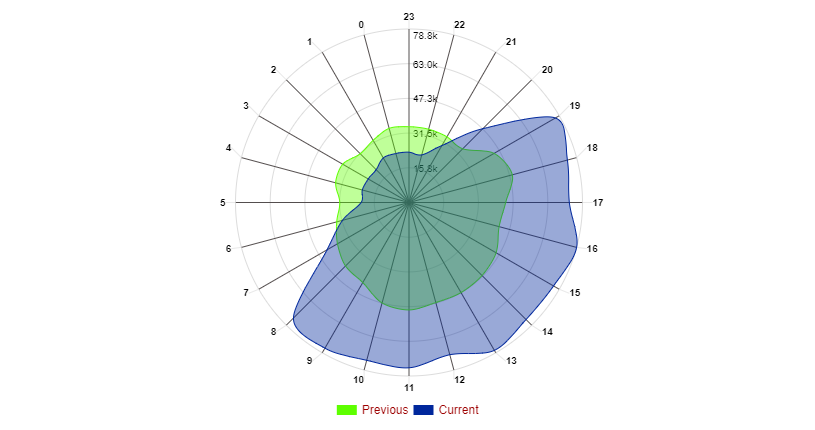
A Radar Chart is one of the visualization tools that can aid your data processing systems. It helps you understand your information at a simple glance, enhancing your options of making more accurate decisions.
We want to learn how you can use the Radar Chart in this blog, especially how to get competitive analysis. So let’s ride together to find out everything you need to know about Radar Charts.
What is a Radar Chart?
Also known as the Spider Chart or Polar chart, a Radar Chart helps graphically display information to enhance the viewers’ understanding.
The Radar Chart works precisely like other visualization tools such as bar charts, pie charts, and histograms. However, a Radar Chart goes beyond them.
The Radar Chart functions to help you do competitive analysis by finding out what your competitors are doing, what their results are, and how they affect you and your business.
Typically, to plot a Radar Chart, we use multivariate data to plan a group of values on multiple variables commonly represented on axes from the same point. Thus, the Radar Chart is an excellent comparing tool that compares several alternatives against criteria at the same time. It will usually, in turn, help you to decide to choose the best options based on merits.
If you put it simply, the Radar Chart helps you to make more accurate decisions because rather than guessing your way out, you can make decisions based on generated data and more objectively.
Benefits of the Radar Chart
Now that you understand what the Radar Chart is, you need also to know the benefits you can derive from using it. Firstly, Radar Charts help you in decision making. As a business owner, it’s essential to make the right decisions at all times. Using a Radar Chart will give you a simple visualization of multivariate data and help you to choose the best based on merit.
Also, it gives you a competitive analysis for different products. As stated at the beginning of this blog, a Radar Chart will help you understand what your competitors are doing and how their results have affected your products.
The Radar Chart also helps you find out gap analysis easily because you can plot your present state and desirable state on the same graph to have a quick view of the gap between them.
It will also help you determine customer satisfaction by capturing how all organization stakeholders perceive the organization through performance metrics.
How to create a Radar Chart
There are six steps in creating a Radar Chart in Google Sheets. Let’s check them below:
- Designate a variable to an axis.
- Each axis is radially arranged around a central point. Ensure you space the axes from one another equally.
- Plot data from a single observation along each axis and connect it in the form of a polygon.
- Display multiple polygons by placing additional observations in a single chart.
- Spread them across and make adjustments on each of the polygons for each observation.
- Critically inspect the gaps or differences among the variables assigned to each observation.
How to use Radar Charts for Competitive Analysis
One of the ways you can improve your business is to find out your competitors’ strengths and weaknesses as concerns your service or products. Then, when you evaluate your competitors, you will understand your business better and how your competitors’ results have affected you. In turn, you can leverage the information you gather to improve your strengths and weaknesses. Before you can use Radar Charts for competitive analysis, you need to follow the tips below;
1. Have excellent data sources
In doing competitive analysis, you must have adequate information about your competitors. Getting information can sometimes be easy as you may find them online. However, there are times that it could be challenging to access some essential information that will aid your competitive analysis because of confidentiality. As a result, a lack of appropriate information or data will affect the quality of the competitive analysis you want to perform.
2. Define criteria for analysis
Another thing you need to ensure is to clearly know the criteria you want to use for your competitive analysis. The requirements will be labelled on your Radar Chart to make sure you can visualize your results more easily. Criteria could include average sales, quality, durability, price, product selection, and others. Each of the requirements will have a different axis to give you a distinct shape.
3. Engage the right tools
To get the competitive analysis right, you have to use the right interactive assessments tools. Use software such as lead quizzes, Typeform, survey anyplace, riddle, ion interactive to ensure you get the accurate representation.
4. Have expected ranges of results
It’s essential to know what you are hoping to get before you even start your competitive analysis. Ensure you set your desired results to know what to look out for when you begin your analysis. Draw the approximate shapes you are expecting for each of the scenarios.
5. Compare ratings from customers
How your customers perceive your business and that of your competitors matters a lot. Try to find out your customers’ rating in comparison with that of your competitors. Carry out survey research to get customers’ perceptions of your business and your competitors. It will help you determine your level and how close you are to getting to the ideal score.
6. Define your strategy
There is no guarantee that your competitive analysis will be perfect if you don’t use the right approach. Define your strategy nicely and set up your competitive analysis campaign.
Conclusion
One of the ways to improve your business is to understand what your competitors are doing. You must be able to find out the strengths and weaknesses of your competitors and how you can perform better. The information you get will help you to make the right decisions that can move your business forward.
Competitive analysis helps you to understand your competitors and the effects of their results on you. It would be best if you used a Radar Chart for your competitive analysis, and that’s what this blog is all about. If you want to find out how you can use your Radar Charts to determine your competitors’ strengths and weaknesses, then you need to read this blog.